

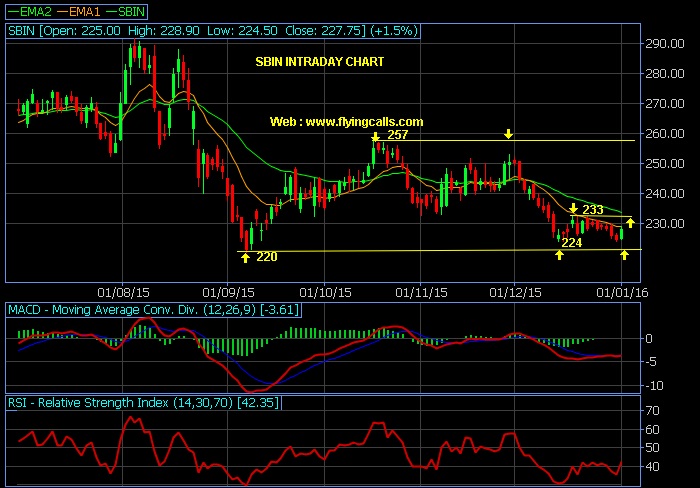
( Last Close : 227.75 )
Above is SBIN Six Month Intraday Chart
Chart shown, Stock facing strong and bottom out level around 220
Bulls can buy at lower levels and keep a stop of 220 closing basis
Expected Rally up-to 245 & 257
Suppose if close below 220………. Next supports around 195-200!!
Updated : 07.16 PM / 01st Jan 2016