

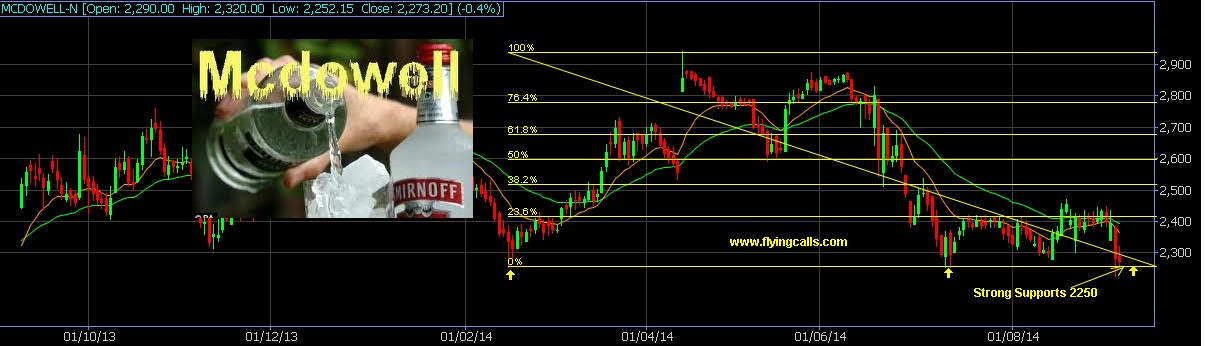
Above is MCDOWELL-N One Year Intraday chart & Click chart to Enlarge
MCDOWELL-N currently trading at 2262
Now Chart shown strong support and Fibonacci level around 2250
Once if breaks 2250 and Close below the levels
Next support at 2050 and 1900 levels
Bears Ready to Enter………

Updated : 11.13am / 09th Sept’14