

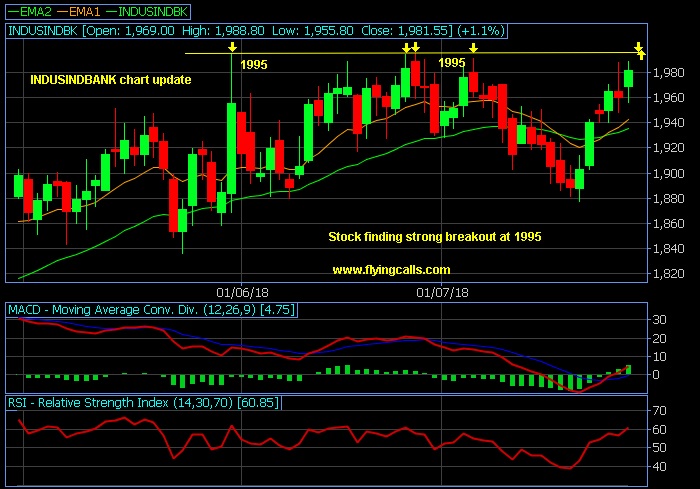
Last close : 1981.55
Indusindbank technical chart indicating strong breakout at 1995
Already stock has formed triple top at 1995
On coming trading days stock once if breaks 1995 and holds above the level
Bulls action expecting and rally will be expected up to 2020 & 2035+
Closely eye on breakout level and catch if it breaks!!
Updated : 10.52 AM / 28th July 2018