

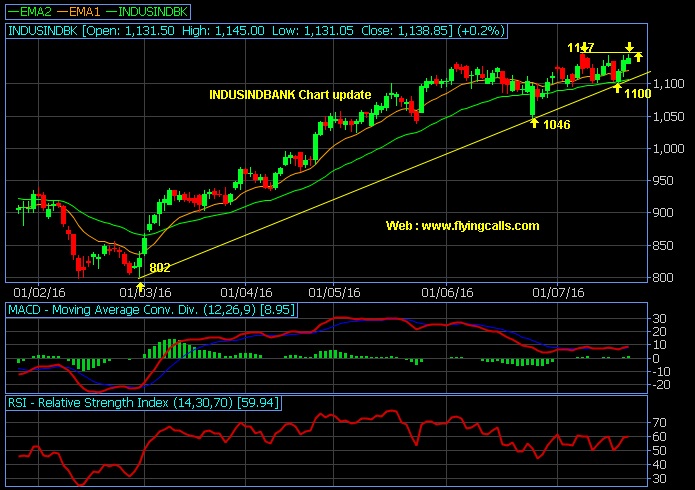
Last close : 1138.85
Above is Indusindbank last Six Months Intraday chart
Chart shown strong resistance at 1147
Stock once if breaks 1147 and close above the level……… Rally will be expected
Finding next resistance around 1180 & 1210
Strong support at 1100……. Below the level bears will have an upper hand
Updated : 02.48 PM / 23rd July 2016