

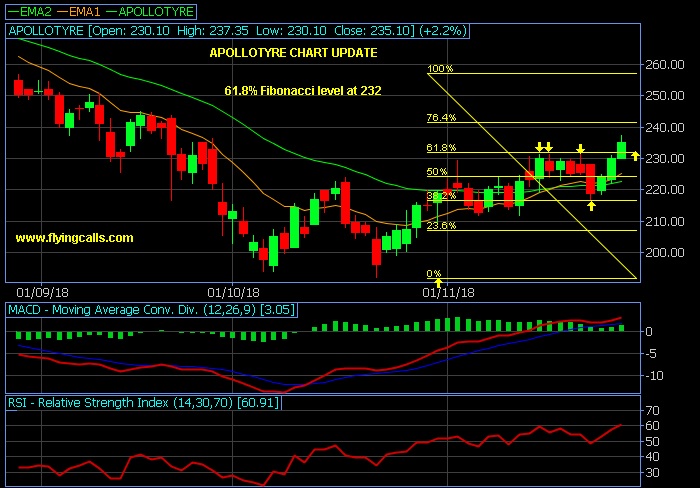
Today’s chart of the Day : APOLLOTYRE
Technically chart indicating stock finding Fibonacci retracements 61.8% at 232
Stock if breaks and closes above the level, Finding next resistance around 245 & 252
Stock will takes supports around 222 and 218.
Updated : 12.46 PM / 28th Nov 2018