

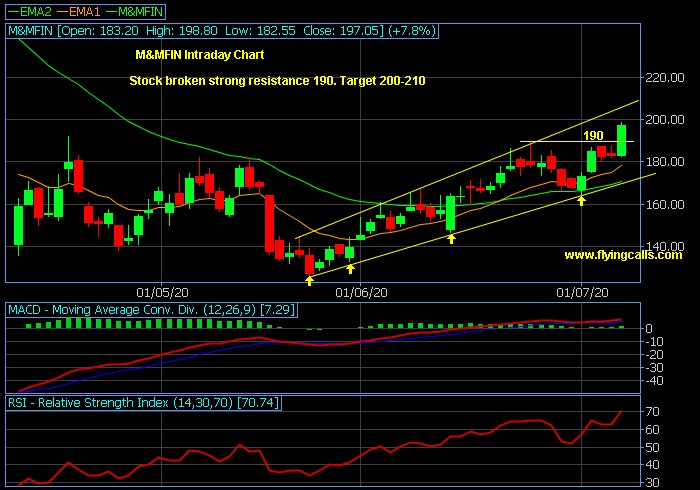
While updating M&MFIN were trading around 195
As per technical chart indicates M&MFin finding a strong trend line resistance at 190
Stock broken the breakout point and formed strong bullish candle
If closes above 190, Rally will be expected up to 205 and 220 for positional
Now stock considering a support at 180
Updated : 11.08 am / 07th July 2020