

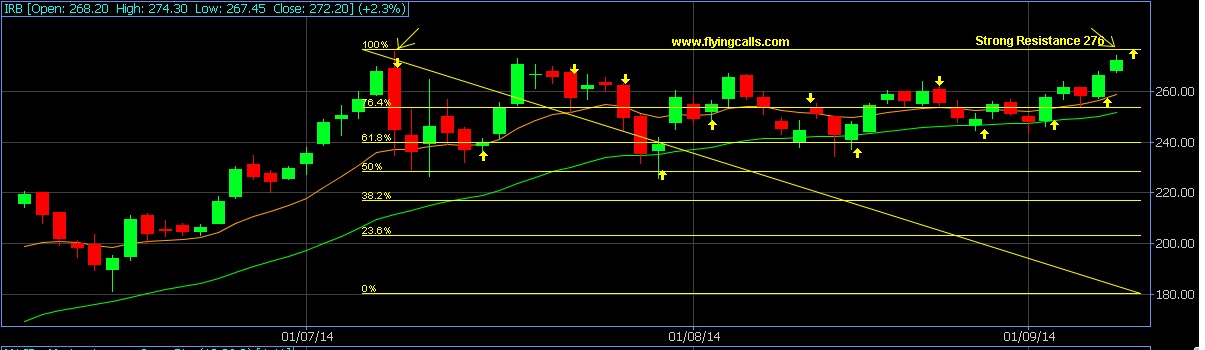
Above is IRB last Three Months Intraday Chart & Click chart to Enlarge
IRB Chart shown now Golden Breakout & 100% Fibonacci Levels
Yes, Strong Breakout @ 276, Currently trading at 273.50
Closely watch 276 levels………. Once if crosses the levels & Close above the levels……..
We see Next Resistance 287 & 305 levels shortly!!!
Updated : 10.38am / 08th Sept’14