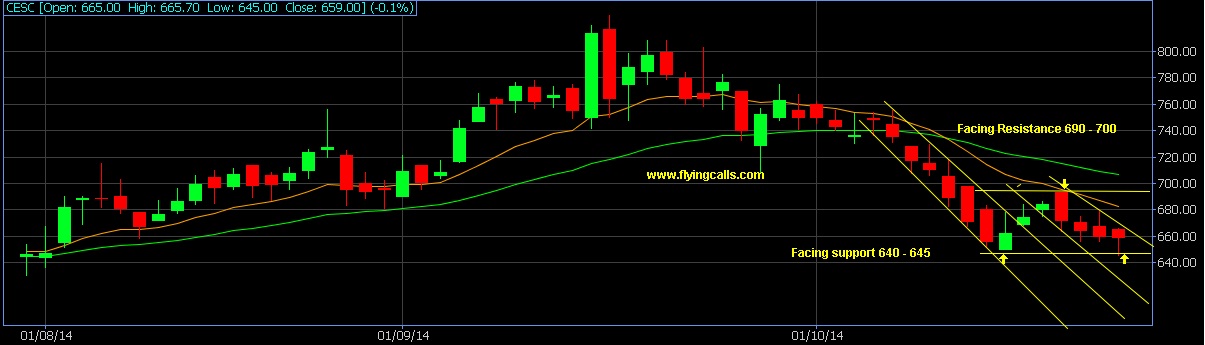
Above is CESC Intraday chart
CESC shown double bottom formation!!!
Currently trading 655……… Can buy & forget
Rally expected up to 695 to 700 levels…….
Stop-loss ??? Sent to our clients!!!
Updated :03.36pm / 30th Oct’14


Above is CESC Intraday chart
CESC shown double bottom formation!!!
Currently trading 655……… Can buy & forget
Rally expected up to 695 to 700 levels…….
Stop-loss ??? Sent to our clients!!!
Updated :03.36pm / 30th Oct’14