

Banknifty (spot) last close: 22479.95
Banknifty was under performed despite of Nifty performed very well from March 24
From March 24th low to still Nifty was gained 54% and Banknifty was gained 37%. Shortage of 17% under perform.
What is the reason ?? Tomorrow I will release Youtube video of one of the reason
Click here to subscribe my Youtube channel
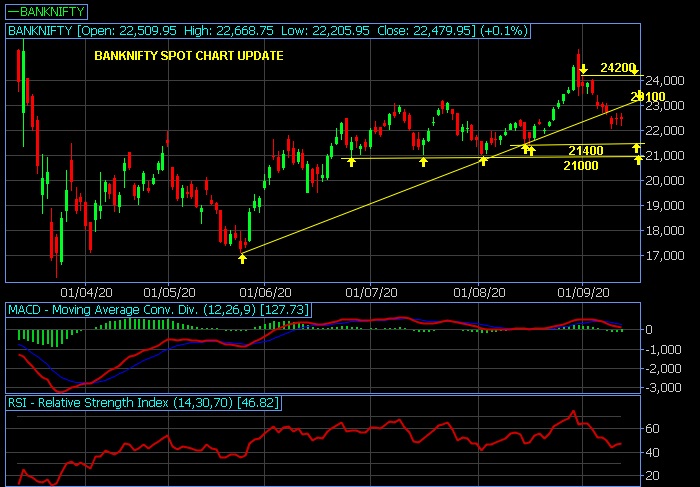
Let’s see……… Coming days banknifty where will take support and resistance ??
In last 10 days index was broken previous day’s lows. This one is weak sign
Banknifty considering a weekly supports 21850-22000. It is a very strong support.
Suppose index if not takes support at 21850 and closes below the level
Expecting further weakness up to 21400 and 20900
On another hand……..Banknifty is facing a weekly resistance 23000 and 23400
Technical chart indicating there is no strength at higher levels in last 10 days chart
Suppose if crossover 23400………. Will try to check 24200
But……… Every rise can sell likes resistance zone!!
I didn’t expect that much of level until 28th Sept…….Because next moratorium hearing on 28th
Updated: 05.33 pm / 12th Sept 2020