Apollohosp chart indicating trend line support at 1324
Now, stock broken 1324 and were trading at 1318. If holds below 1324
Expecting more weakness up to 1300, 1280 levels…….
Facing a resistance 1330-1343.
Updated : 12.51 PM / 25th June 2019


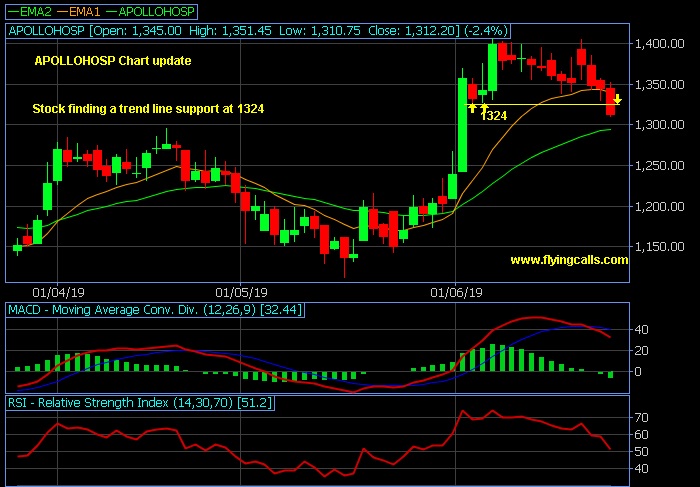
Apollohosp chart indicating trend line support at 1324
Now, stock broken 1324 and were trading at 1318. If holds below 1324
Expecting more weakness up to 1300, 1280 levels…….
Facing a resistance 1330-1343.
Updated : 12.51 PM / 25th June 2019